Imagine a car or truck speeding away in front of you on the road. Here is a rough method to estimate its distance and speed using your outstretched hand (try this as a passenger, not a driver!).
At any given time its distance away is approximately
We use the figure below to estimate angles based on our outstretched hand at arm’s length:
Hence a vehicle that is 2m wide subtending an angle of 5 degrees (3 fingers at arm’s length) is about 23m away. At 1 degree (1 little finger at arm’s length) it is about 115m away.
Then measure the time T (in seconds) it takes to go from 3 fingers width (5 degrees) to 1 little finger width (1 degree) at arm’s length. Its relative speed in km/h is approximately given by
For example, if a 2m-wide car takes 33 seconds to go from 3 fingers to 1 little finger width at arm’s length (115-23=92 m in distance), it is going 10km/h faster than I am.
To justify these formulas, the figure below shows segment BC of width w at distance d from A, subtending an angle of . Using trigonometry we find . For small angles, where is measured in radians, an approximation that is only around 1% inaccurate even when is as large as 20 degrees.
Formula (1) then follows from and the fact that angles in radians are times angles in degrees.
Formula (2) is true since we are covering a distance in time T. Multiplying this by 3.6 to convert from m/s to km/h gives us the approximate scale factor of 165.
The table below shows some sample values for a car with width 2m and truck with width 3m.
Angle subtended by object (degrees)
Width of vehicle (m)
Distance of object (m)
Approximate distance using (1)
20
2
5.7
5.7
10
2
11
11
5
2
23
23
1
2
115
114
0.02
2
5730
5700
20
3
8.5
8.6
10
3
17
17
5
3
34
34
1
3
172
171
0.02
3
8600
8550
Distance estimates based on the angle and width of an object.
The smallest angle of 0.02° (~1 minute) approximately corresponds to the smallest object we can resolve with the naked eye.
The next table shows estimates of receding speeds based on going from 5° to 1° of angular diameter.
Width of vehicle (m)
Time (s) to go from 5° to 1°
Estimated speed (km/h)
2
3
110
2
5
66
2
10
33
2
33
10
3
5
99
3
10
50
3
33
15
Speed estimates based on the width and time taken to go from 5° down to 1°.
We present here a calculation of the location of a star as a function of its declination, the observer’s latitude and time after it is at its highest position in the sky. We use the fact that stars trace out circular paths about a fixed point in the sky.
The image below shows a celestial sphere centred on an observer at the location . Assume the observer is in the northern hemisphere and the point represents the north celestial pole about which the stars appear to rotate anti-clockwise as the earth rotates on its axis (in the southern hemisphere stars rotate clockwise about the south celestial pole). The red ellipse illustrates the circular path of a star over a 24-hour period – point is its highest location while point is where it will be after a quarter of a day. Also shown in the diagram are axes (pointing east), (pointing north), (pointing directly overhead) and corresponding unit basis vectors , and .
Our aim is to find the location of the star (in 3-dimensional coordinates) on the red circle given:
– the time (as a proportion of a day) after the star has reached its highest point
– the angle of declination of the star (-90° to 90°) – the angle between the star and the celestial equator (which is the earth’s equator projected skyward)
– the latitude of the observer (-90° to 90°)
The point is fixed as the earth rotates and in the north direction with an angle of elevation equal to the location’s latitude. Hence we may write
Next consider the angle between and . If , we would have a northern pole star and . If we would have a star on the celestial equator and . More generally,
The point has an angle of elevation of , hence we have
The circular path of the star can be regarded as a point traced around by a line having fixed angle from the fixed line . This circle has its centre at the point which is the projection of onto the segment . Note that does not lie on the sphere but , and do. We have
and
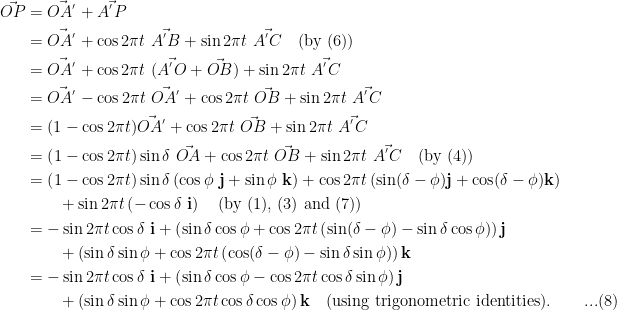
We parameterise any point on this circular path by expressing it in terms of the basis vectors and . For any point on the path we can write
For example,
if ,
if ,
if ,
if ,
Since has the same length as and is pointing directly west (i.e. perpendicular to both and ), we have from (5):
We now have all the ingredients we need to find :
In this formula, the angle of elevation is found by setting equal to the -component, or
Let us test out formula (8) in some special cases:
If we recover the formula , the fixed location of the pole star.
If we recover the formula . This traces a circle with diameter joining and (two antipodal points), hence it is a great circle on the celestial sphere.
If (observer on the equator) we obtain , hence the -component remains fixed and a circular path is traced.
If (observer at the north pole) we obtain , hence the star traces out a circle with constant angle of elevation.
We can also determine the times at which a star rises or sets by setting the -component of position in (8) to 0:
This is the so-called sunrise equation and was derived differently in an earlier blog post in [1].
Next let us look at the case when the star is our sun. The declination changes during the year between -23.4° and +23.4° (earth’s axial tilt) between the winter and summer soltice (for the northern hemisphere) as the earth revolves around the sun. Assume that the centre of the sun is at the origin and that earth’s orbit is the x-y plane having the form (assuming a circular orbit with radius starting at at ). The parameter here represents the fraction of year after the winter solstice. Earth’s axis of rotation points in the direction , being tilted away from the sun in the north when .
From the earth’s point of view the sun is in the direction . Then the angle between the sun’s position and the earth’s axis satisfies
For example if , we have . If , we have the equinoxes and . Finally if then .
Substituting (10) into (8) gives the location of the sun given the time of year and time relative to when it’s at its highest point in the sky (solar noon). Note that the equation is not perfect since it does not take into account atmospheric refraction or the fact that the earth’s orbit is not perfectly circular and therefore the earth is not uniform in speed. For more exercises on the length of days based on latitude and the sun’s angle of declination refer to [2].
Finally, we can determine the bearing of a star when it rises or sets in the following manner. The position of the sun is in the x-y plane and so has the form
Secondly and hence
Hence . For example taking the sun on the summer solstice at Melbourne, Australia we have , and so . This corresponds to a bearing of , around 20 degrees south of east. The answer given in timeanddate.com is , slightly more perhaps because it takes into account refraction and the fact that the sun is not pointlike.
I have created a few interactive charts with Tableau on winning/losing/drawing international men’s cricket streaks using data from ESPNcricinfo.com’s Statsguru. You can click on any of the links or graphs to interact with it in a new page.
Largely due to timeless tests in Australia up to World War II, Australia had 0 drawn tests at home Australia for 87 consecutive tests until 1946. For similar reasons England had 0 drawn tests away from home for 66 consecutive tests up to 1914 when they drew in South Africa.
The top streaks without a loss for any team anywhere are 27, 26 and 25 by West Indies (1982-84), England (1968-71) and Australia (1946-51) respectively.
England amazingly lost only 1 test away from home in 40 matches between 1963 and 1972.
At home Pakistan lost only 1 test out of 40 from 1969 to 1986 while India only lost once in a span of 35 tests between 2012 and 2019.
West Indies lost only 2 out of 53 tests between 1980 and 1986 and just 10 out of 100 from 1976 to 1988.
Australia won 12 consecutive tests at home between 1999 and 2001 and 49 out of 61 home tests between 1998 and 2008. India is not far behind with 40 out of 53 home test wins from 2010 to 2021.
In any ground Australia won 76 out of 100 tests between 1999 and 2008.
South Africa has played 32 consecutive matches (anywhere) without a draw from 2017, an active streak. The next best is 26 by Zimbabwe from 2005 to 2017.
New Zealand has an impressive active streak of 17 matches without a loss dating back to 2017 with 8 of their 13 wins by an innings.
One-day Internationals:
Australia lost just 2 matches out of 32 anywhere between 2002 and 2003.
India lost only 1 match out of 16 away from home between 2016 and 2018.
West Indies lost only 7 matches out of 50 in away or neutral grounds between 1981 and 1985.
Four teams have won 16 consecutive ODIs at home – Australia (2014-16), South Africa (2016-17), Sri Lanka (1996-98) and West Indies (1986-90). The best is 18 by Australia and Sri Lanka.
Australia (1999-2004), Sri Lanka (1994-2004) and South Africa (1994-2001) all won 53/65 matches at home.
T20 Internationals:
Afghanistan and Romania share the record of consecutive wins (12).
Zimbabwe had 16 consecutive losses (2010-13).
Afghanistan (2016-19) and Pakistan (2017-18) have both won 23 out of 26 consecutive games.
In this post I would like to prove the following identity, motivated by this tweet.
The first of these equalities is straightforward by the definition of binomial coefficients. To prove the second, we make use of partial fractions. We write the expansion
where the coefficients are to be determined. Multiplying both sides by for some ,
Then setting in both sides gives
leading to the desired result.
As a few examples of this identity we have:
I had previously posted an identity with similar, but trickier derivation here.
Below are shown a few sample charts. Clicking on the chart will take you to a new page where you can interact further.
Test batting:
Two players had a batting average over 100 after 10 test inningsA player’s stats can be viewed by opposition.
Test bowling:
Jason Holder has had an all-time great low bowling average over 20 consecutive innings, Steve Waugh also features here.Early players dominate the list of fastest to 5 6-wicket hauls in tests.
ODI batting:
Kohli averaged almost 70 per innings over 50 consecutive innings, Warner also has also done very well from 2016-2019.Shahid Afridi’s maintained this high a batting strike rate over 50 innings between 2004 and 2007.
ODI bowling:
Rashid Khan took 11 more wickets than the next best over 30 consecutive innings.Over 100 ODI innings, Muralitharan averaged more than 2 better than the next best.
In this post we find the largest parallelogram, rhombus, rectangle and square that can be contained in a given triangle. We will see that in the first three cases we can achieve half the area of the triangle but no more, while it is generally less than this for a square.
Inscribing a parallelogram, rhombus, rectangle and square of maximum area in a triangle
1. The largest parallelogram inside a triangle
It can be readily seen that one can obtain a parallelogram having half the area of a triangle by connecting a vertex with the three midpoints of the sides. (This has half the base length of the triangle and half its height.)
Is it possible to obtain a larger parallelogram? As outlined in [1], if two or fewer vertices of the parallelogram are on sides of the triangle, a smaller similar triangle can be created by drawing a line parallel to the triangle’s side through a vertex of the parallelogram that is interior triangle. (This is done three times in the figure below.) This reduces the problem to the next case.
A smaller similar triangle containing the parallelogram can be created by lines through its vertices parallel to the sides of the triangle
We are left to consider the case where three or more vertices of the parallelogram on the triangle. We can draw a line from a vertex to the opposite side parallel to a pair of sides (in the figure below is drawn parallel to ), thus dissecting the triangle into two. Each of the smaller triangles then has an inscribed parallelogram where two of the vertices are on a side of each triangle. Then by drawing lines parallel to sides if required, we create two sub-problems each having four vertices of the parallelogram on the sides of the triangle.
Dissecting a triangle so that each smaller triangle has a parallelogram with two vertices on a side. The right parallelogram is contained in a larger one formed by lines parallel to the sides.
Finally, if all four vertices of the parallelogram are on sides of the triangle, by the pigeonhole principle, two of them are on a side (say as shown in the figure below). In this figure, if we let and the height of ABC from be , then by the similarity of triangles and , and has height . Then the area of the parallelogram is which is times the area of . This quantity has maximum value 1/2 when so we conclude that the parallelogram does not exceed half the triangle’s area.
A parallelogram with all four vertices on sides of a triangle must have two of them on one side.
2. The largest rhombus in a triangle
Constraining sides of the parallelogram to be equal (forming a rhombus), we claim that the largest rhombus that can be inscribed in a triangle is also half its area. This can be formed with two of the vertices on the second longest side of the triangle. Suppose are the sides of the triangle with the second longest side length. Then let the segment joining the midpoints of and form one side of the rhombus of length . It remains to be shown that there exist parallel segments of this same length from to . The longest possible such segment has length and the shortest has length , half the length of the altitude of from . We wish to show that . This follows from
Inscribing a rhombus of maximal area in a triangle
The area of this rhombus is clearly half the area of the triangle as it has half the length of its base and half the height.
3. The largest rectangle in a triangle
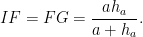
Here if is the longest side of the triangle we form the rectangle from midpoints of and respectively, dropping perpendiculars onto forming rectangle :
The largest rectangle inscribed in a triangle, where D and E are midpoints
The area of this rectangle is half the area of the triangle as it has half the length of its base and half the height.
Interestingly the reflections of the vertices of the triangle in the sides of the rectangle coincide, showing a paper folding interpretation of this result [2].
Reflecting A, B and C in DE, DG and EF respectively yields the same image, yielding a paper folding interpretation
Since rhombuses and rectangles are special cases of parallelograms and we found that inscribed parallelograms in a triangle occupy no more than half its area, the rhombus and rectangle constructions here are optimal.
4. The largest square in a triangle
Here we shall see that the best we can do may not be half the area of the triangle. As before, if two or fewer vertices of the square are not on the sides of the triangle it is possible to scale up the square (or scale down the triangle) so that three of the square’s vertices are on the sides. We claim that the largest square must have two of its vertices on a side of the triangle. Suppose this is not the case and we have the figure below.
Squares with a vertex on each side of pivot about the point
Consider squares inscribed in so that one vertex is on , is on and is on . We claim that the largest such square is either (two vertices on ) or (two vertices on ). Suppose on the contrary that neither of these squares is the largest. Then we make use of the fact that all 90-45-45 triangles inscribed in have a common pivot point. This is the point at the intersection of the circumcircles of triangles , and . To show these circles intersect at a single point, we can prove that if the circumcircles of triangles and intersect at then the points are cyclic by the following equality:
where the second last equality makes use of quadrilaterals , being cyclic.
Additionally we have
with similar relations for and . Hence is the unique point satisfying
(Each equation defines a circular arc, they intersect at a single point. Note that may be outside triangle .) This point is the centre of spiral similarity of 90-45-45 triangles with respectively on the sides of the triangle. Consider the locus of the points of the square as vary on straight line segments pivoting about . It follows that the fourth point of the square also traces a line segment, between the points and so as to be contained within the triangle.
As the side length of the square is proportional to the distance of a vertex to its pivot point, the largest square will be where is maximised. We have seen that the point varies along a line segment, so will be maximised at one of the extreme points – either when or . We therefore conclude that the largest square inside a triangle will have two points on a side.
If the triangle is acute-angled, by calculating double the area of the triangle in two ways, the side length of a square on the side of length with altitude is derived as
If the triangle is obtuse-angled, the square erected on a side may not touch both of the other two sides. In the figure below the side length of square is the same as if were moved to , where is right-angled. In this case the square’s side length is .
The square erected on side when is obtuse
The largest square erected on a side may be constructed using the following beautiful construction [2]: simply erect a square CBDE external to the side and find the intersection points .
These points define the base of the square to be inscribed since by similar triangles
so that
One can use this interactive demo to view the largest square in any given triangle. One needs to find the largest of the three possibilities of the largest square erected on each side. In the acute-angled-triangle case, the largest square is on the side that minimises the sum of that side length and its corresponding perpendicular height – as their product is fixed as twice the triangle’s area, this will occur when the side and height have minimal difference. For a right-angled triangle with legs and hypotenuse , we wish to compare the quantities and , the two possible sums of the base and height of the triangle. We always have because the diameter of the incircle of the triangle is shorter than the altitude from the hypotenuse (i.e. the incircle is inside the triangle). We conclude that the largest square in a right-angled triangle is constructed on its two legs rather than its hypotenuse.
References
[1] I. Niven, Maxima and Minima without Calculus, The Mathematical Association of America, 1981.
[2] M. Gardner, Some Surprising Theorems About Rectangles in Triangles, Math Horizons, Vol. 5, No. 1 (September 1997), pp. 18-22.
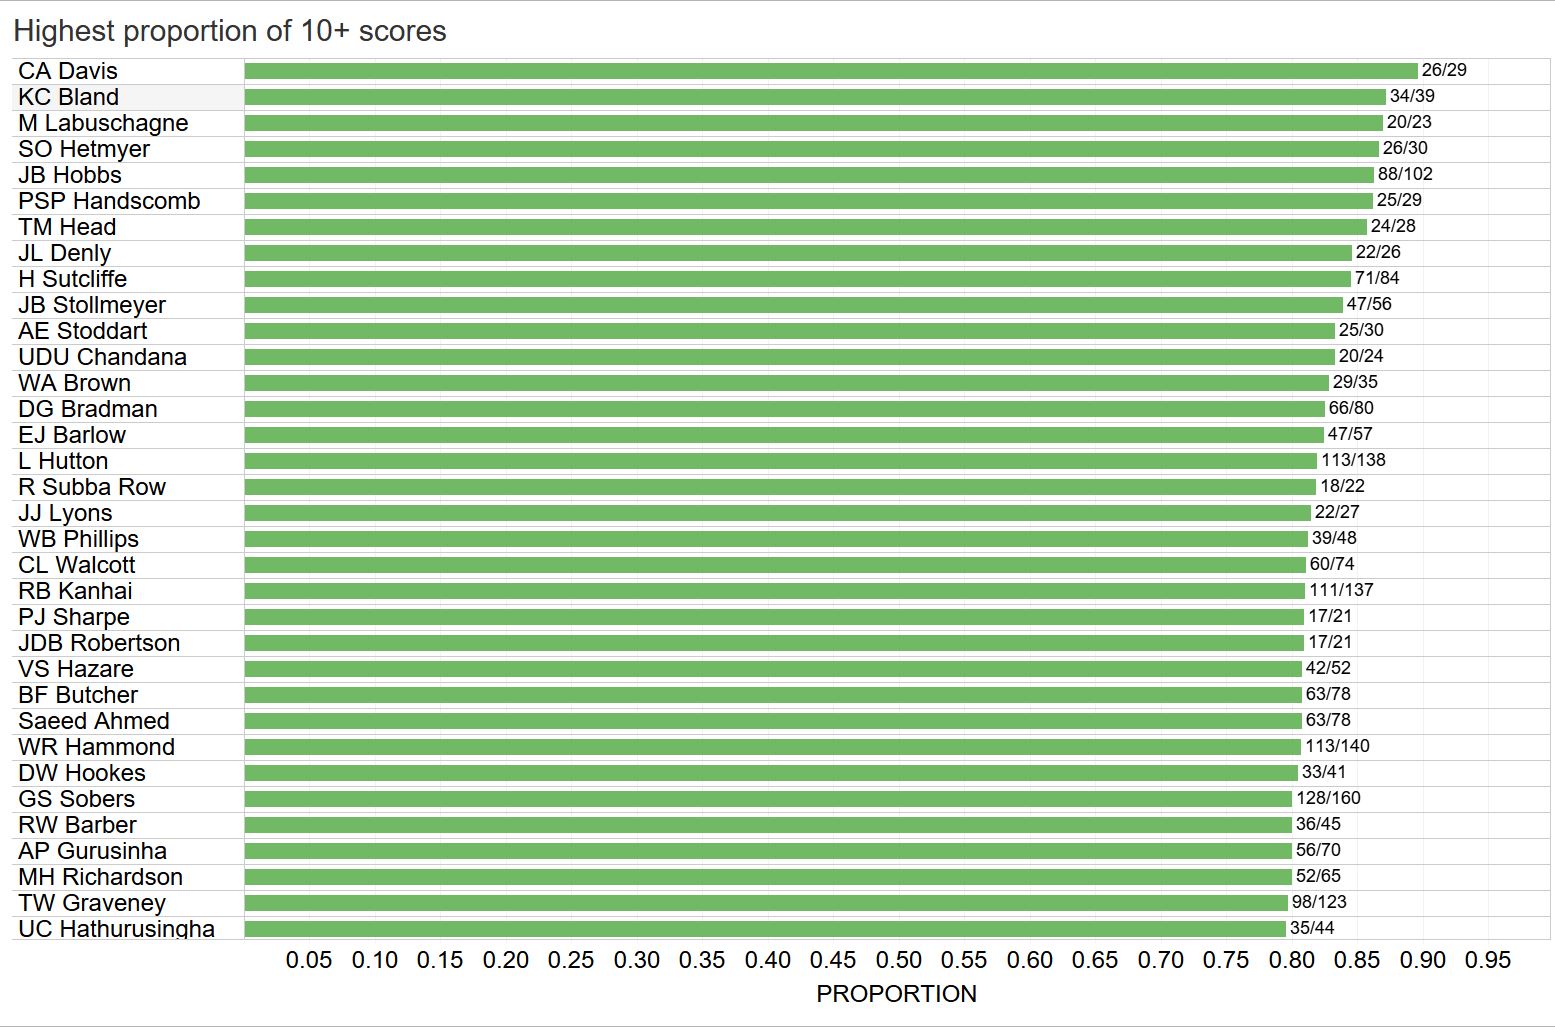
I created an interactive workbook with Tableau to determine the test batsmen who have had the highest proportion of innings scoring at least m runs after having played n test innings. Below are some screenshots for particular choices of m runs. The data is available from [1]. As expected Bradman comes up on top in many scenarios but it is interesting to see other names that appear up there.
(Click on the above image to go to the Tableau page if you wish to change the parameters. You can also select the “Innings by innings” tab to look up a player’s list of innings.)
Below we some examples for different m (full-career stats among players who have played at least 20 innings).
m=1: A total of 22 players have had an entire career of 20+ innings getting off the mark each time, with RA Duff (Australia, 1902-1905) the only to play 40 innings (note that JW Burke played 44 innings without a duck, but made 0 not out in one innings).
Angelo Mathews (SL) has managed just 2 ducks in his 154 innings to date.
m=10: Hobbs, Hutton, Kanhai and Sobers stand out here, having played over 100 innings and reaching double figures at least 80% of the time (Hobbs over 86%). Labuschagne, Hetmyer, Handscomb and Head are recent players to feature highly here.
m=25: Bradman starts to distance himself from the rest. Hammond, Smith, Sobers and de Villiers also impress here.
m=50: Smith has matched Barrington’s career figures of 50+ starts. Sutcliffe had 33 50+ scores in his first 64 innings, the same as Bradman.
m=75: Barrington’s numbers are amazing here and Katich is ahead of Kohli, Tendulkar and Lara.
m=100: Smith and Kohli are currently higher than Sangakkara, the highest among recent retirees.
m=125: Only Bradman (6) had more 140+ scores than Labuschagne after playing 23 test innings, equal with Graeme Smith (who had 4 150+ scores in his first 17 innings!).
m=150: Bradman is so far ahead of the rest here. Lara and Sangakkara are just one behind Tendulkar with the most 150+ scores despite almost 100 fewer innings.
m=175: Again Lara and Sangakkara have the same number of 175+ scores (15).
m=200: Kohli is similar to Hammond’s career figures at this stage, with 6 of his 7 double centuries coming within 33 innings between July 2016 and December 2017.
Please leave any other interesting observations in the comments.
One thing I observed is that the 3-4-5 triangle is rather attractive in solving problems using coordinates. If the vertices are placed at (0,3), (0,0) and (4,0) the following are the coordinates of points and equations of some lines of interest.
Line AC:
Incentre:
Centroid:
Circumcentre:
Orthocentre:
Nine-point centre: (midpoint of the midpoints of AB and BC)
Angle bisectors:
Ex-centres (intersection of internal and external bisectors):
Lines joining the excentres (in red above):
Altitude to the hypotenuse:
Euler line:
Foot of altitude to the hypotenuse: (where intersects )
Symmedian point (midpoint of the altitude to the hypotenuse [1]):
Contact points of incircle and triangle:
Gergonne point (intersection of Cevians that pass through the contact points of the incircle and triangle = the intersection of and ):
Nagel point (intersection of Cevians that pass through the contact points of the ex-circles and triangle = the intersection of and :
Below is a list of recorded instances of maximum temperatures of 49 degrees Celsius or more in Australia, based on [1] and [2] from Australia’s Bureau of Meteorology. Out of the 48 52 occasions, 22 26 have occurred in this decade including 8 (so far) during this summer alone! I believe all the stations have been recording temperatures for at least 20 years except Port Augusta and Keith West (which both started in 2001). Edited: 20 Dec 2019


 . Assume the observer is in the northern hemisphere and the point
  represents the north celestial pole about which the stars appear to rotate anti-clockwise as the earth rotates on its axis (in the southern hemisphere stars rotate clockwise about the south celestial pole). The red ellipse illustrates the circular path of a star over a 24-hour period – point
  is its highest location while point
  is where it will be after a quarter of a day. Also shown in the diagram are axes
  (pointing east),
  (pointing north),
  (pointing directly overhead) and corresponding unit basis vectors
  ,
,  and
and  .
.
 – the time (as a proportion of a day) after the star has reached its highest point
 – the angle of
  – the latitude of the observer (-90° to 90°)
 . If
. If  , we would have a northern pole star and
  . If
. If  we would have a star on the celestial equator and
  . More generally,
 , hence we have
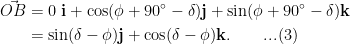
 from the fixed line
  which is the projection of
 and
and  . For any point
  on the path we can write
![\displaystyle \vec{A^{'}P} = \cos 2\pi t\ \vec{A^{'}B} + \sin 2 \pi t\ \vec{A^{'}C}, \quad t \in [0, 1].\quad\quad ...(6)](https://s0.wp.com/latex.php?latex=%5Cdisplaystyle+%5Cvec%7BA%5E%7B%27%7DP%7D+%3D+%5Ccos++2%5Cpi+t%5C+%5Cvec%7BA%5E%7B%27%7DB%7D+%2B+%5Csin++2+%5Cpi+t%5C+%5Cvec%7BA%5E%7B%27%7DC%7D%2C+%5Cquad+t+%5Cin+%5B0%2C+1%5D.%5Cquad%5Cquad+...%286%29&bg=ffffff&fg=000000&s=0&c=20201002)
 ,
, 
 ,
, 
 ,
, 
 ,
, 
 has the same length as
  and is pointing directly west (i.e. perpendicular to both
  and
and  ), we have from (5):
 :
:
 equal to the
 , the fixed location of the pole star.
 . This traces a circle with diameter joining
  and
and  (two antipodal points), hence it is a great circle on the celestial sphere.
 (observer on the equator) we obtain
  , hence the
  (observer at the north pole) we obtain
  , hence the star traces out a circle with constant angle of elevation.
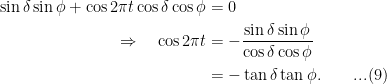
 (assuming a circular orbit with radius
  starting at
  at
at  ). The parameter
  here represents the fraction of year after the winter solstice. Earth’s axis of rotation points in the direction
  , being tilted away from the sun in the north when
  .
. . Then the angle
  between the sun’s position and the earth’s axis satisfies
 . If
. If  , we have the equinoxes and
  then
then  .
.
 and hence
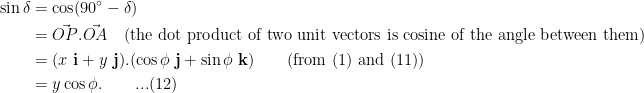
 . For example taking the sun on the summer solstice at Melbourne, Australia we have
  and so
  . This corresponds to a bearing of
  , around 20 degrees south of east. The answer given in
  , slightly more perhaps because it takes into account refraction and the fact that the sun is not pointlike.


 are to be determined. Multiplying both sides by
  for some
 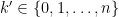 ,
,
 in both sides gives
![\displaystyle \begin{aligned}n=1&:& \frac{1}{x(x+1)} &= \frac{1}{x} - \frac{1}{x+1}\\n = 2&:& \frac{1}{x(x+1)(x+2)} &= \frac{1}{2} \left[ \frac{1}{x} - \frac{2}{x+1} + \frac{1}{x+2} \right]\\n=3&:& \frac{1}{x(x+1)(x+2)(x+3)} &= \frac{1}{6} \left[ \frac{1}{x} - \frac{3}{x+1} + \frac{3}{x+2} - \frac{1}{x+3}\right] \end{aligned}](https://s0.wp.com/latex.php?latex=%5Cdisplaystyle+%5Cbegin%7Baligned%7Dn%3D1%26%3A%26+%5Cfrac%7B1%7D%7Bx%28x%2B1%29%7D+%26%3D+%5Cfrac%7B1%7D%7Bx%7D+-+%5Cfrac%7B1%7D%7Bx%2B1%7D%5C%5Cn+%3D+2%26%3A%26+%5Cfrac%7B1%7D%7Bx%28x%2B1%29%28x%2B2%29%7D+%26%3D+%5Cfrac%7B1%7D%7B2%7D+%5Cleft%5B++%5Cfrac%7B1%7D%7Bx%7D+-+%5Cfrac%7B2%7D%7Bx%2B1%7D+%2B+%5Cfrac%7B1%7D%7Bx%2B2%7D+%5Cright%5D%5C%5Cn%3D3%26%3A%26+%5Cfrac%7B1%7D%7Bx%28x%2B1%29%28x%2B2%29%28x%2B3%29%7D+%26%3D+%5Cfrac%7B1%7D%7B6%7D+%5Cleft%5B+%5Cfrac%7B1%7D%7Bx%7D+-+%5Cfrac%7B3%7D%7Bx%2B1%7D+%2B+%5Cfrac%7B3%7D%7Bx%2B2%7D+-+%5Cfrac%7B1%7D%7Bx%2B3%7D%5Cright%5D+%5Cend%7Baligned%7D&bg=ffffff&fg=000000&s=0&c=20201002)


 is drawn parallel to
  ), thus dissecting the triangle into two. Each of the smaller triangles then has an inscribed parallelogram where two of the vertices are on a side of each triangle. Then by drawing lines parallel to sides if required, we create two sub-problems each having four vertices of the parallelogram on the sides of the triangle.
 formed by lines parallel to the sides.
 as shown in the figure below). In this figure, if we let
  and the height of ABC from
  , then by the similarity of triangles
  and
and  ,
,  and
and  has height
  . Then the area of the parallelogram
  is
is  which is
  times the area of
  . This quantity has maximum value 1/2 when
  so we conclude that the parallelogram does not exceed half the triangle’s area.
 are the sides of the triangle with
  the second longest side length. Then let the segment
  joining the midpoints of
  and
and  . It remains to be shown that there exist parallel segments of this same length from
  to
to  . The longest possible such segment has length
  and the shortest has length
  , half the length of the altitude of
  . This follows from

 of
of 


 inscribed in
  is on
is on  is on
is on  . We claim that the largest such square is either
  (two vertices on
  inscribed in
  ,
,  and
and  . To show these circles intersect at a single point, we can prove that if the circumcircles of triangles
  are cyclic by the following equality:
 ,
,  being cyclic.
 and
and  . Hence
 respectively on the sides
  of the triangle. Consider the locus of the points of the square as
  also traces a line segment, between the points
  and
and  so as to be contained within the triangle.
  is maximised. We have seen that the point
  or
or  . We therefore conclude that the largest square inside a triangle will have two points on a side.
  of a square on the side of length
  with altitude
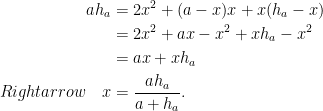

 is the same as if
  , where
  is right-angled. In this case the square’s side length is
  .
.
 is obtuse
 .
.

 and hypotenuse
  , we wish to compare the quantities
  and
and  , the two possible sums of the base and height of the triangle. We always have
  because the diameter of the incircle of the triangle is shorter than the altitude from the hypotenuse (i.e. the incircle is inside the triangle). We conclude that the largest square in a right-angled triangle is constructed on its two legs rather than its hypotenuse.


 (midpoint of the midpoints of AB and BC)


 (where
  )
)
 and
and  ):
): 
 and
and  :
: 
